
Direct Acting Pressure Reducing Valve CFD Validation
How steady state CFD, force balance modelling and hydraulic testing were combined to predict valve regulation behaviour and identify the internal flow mechanisms governing downstream pressure.
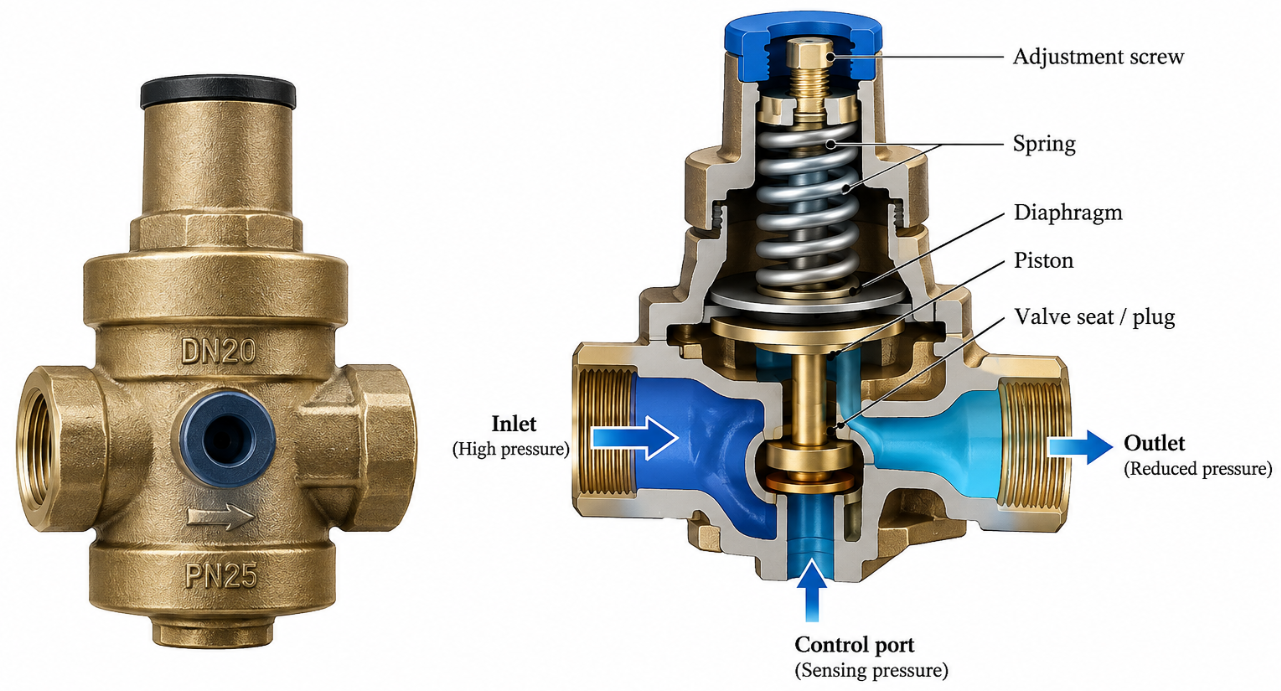
Outlet pressure depended on internal force balance
A pressure reducing valve is not governed by hydraulic restriction alone. The pressure field acts on a moving piston against a spring, so the operating opening changes with flow demand. The challenge was to predict pressure loss, downstream pressure and valve position without relying on a fully transient coupled simulation.
Hydraulic pressure forces and spring restoring force jointly determine the valve opening at each operating condition.
Control port pressure can differ from true downstream pressure as flow rises, so measurement location matters when judging regulation performance.
The model needed to remain computationally efficient enough for iterative design and validation work while preserving the governing physics.
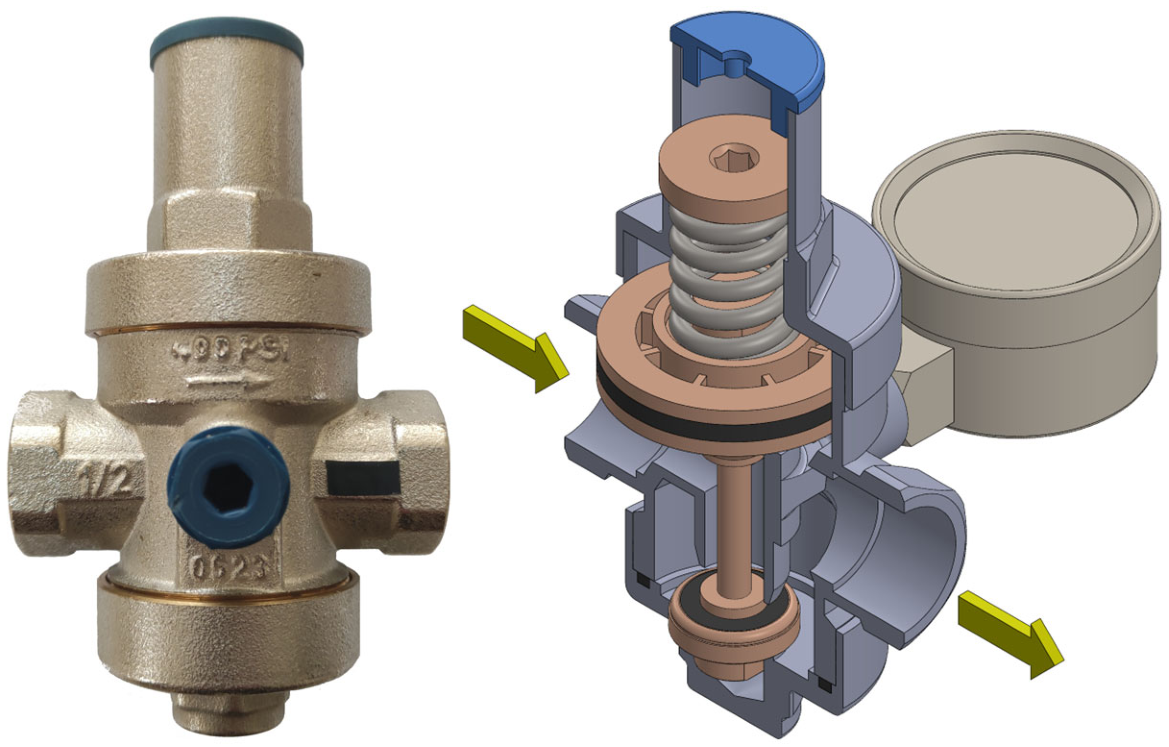
Hydraulic testing combined with CFD
Physical testing established pressure and flow behaviour, while a three dimensional internal flow model resolved the pressure field and hydraulic force acting on the piston. A sequence of fixed valve openings was then paired with the spring restoring force to identify the equilibrium position for each demand condition.
Measure hydraulic behaviour
Record inlet, control port and downstream pressure across the operating range so the regulating response is grounded in physical data.
Resolve pressure and piston force
Use steady state CFD to calculate internal pressure distribution, flow acceleration and the hydraulic force acting on the moving element.
Find equilibrium and validate
Balance hydraulic force against spring force to determine the operating opening, then compare predicted downstream behaviour with test data.
Throttling geometry controlled the pressure loss
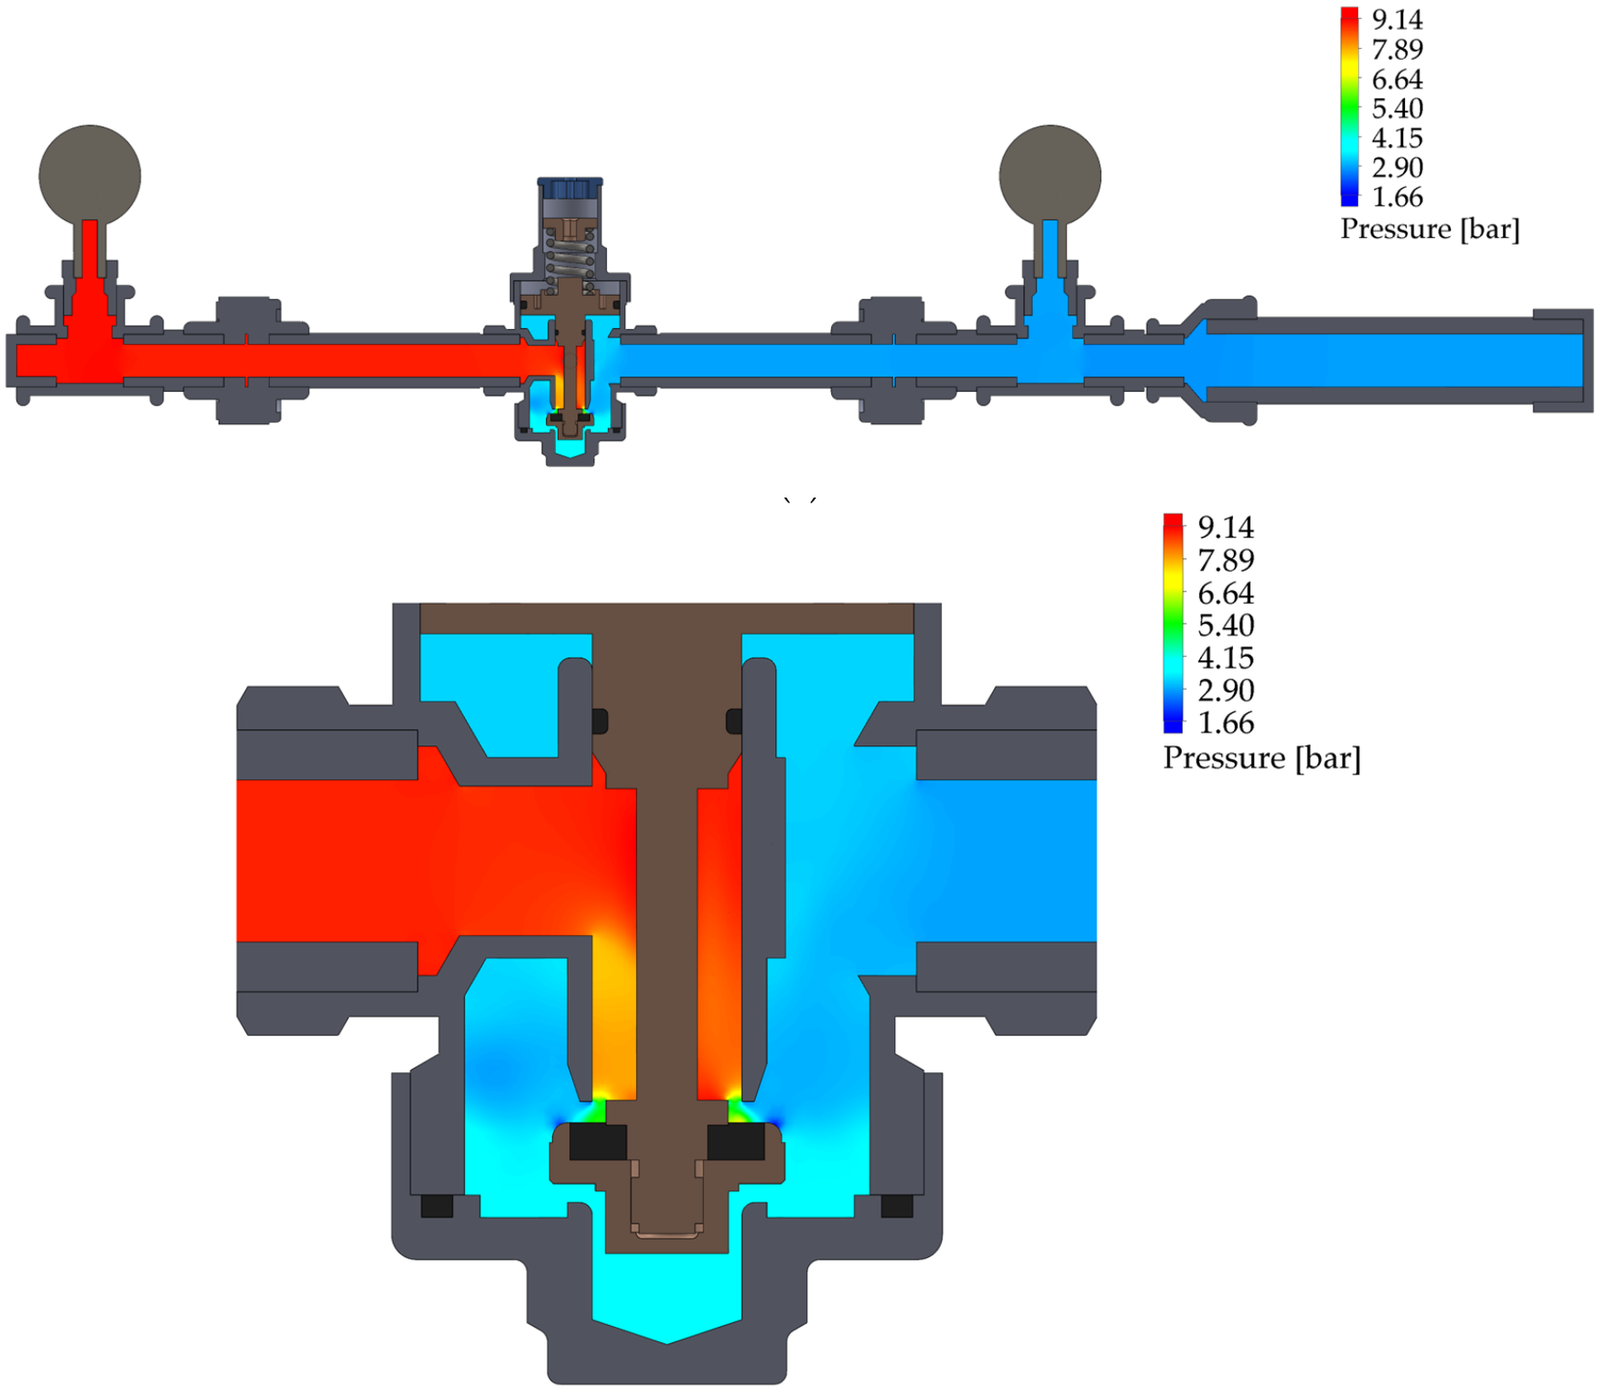
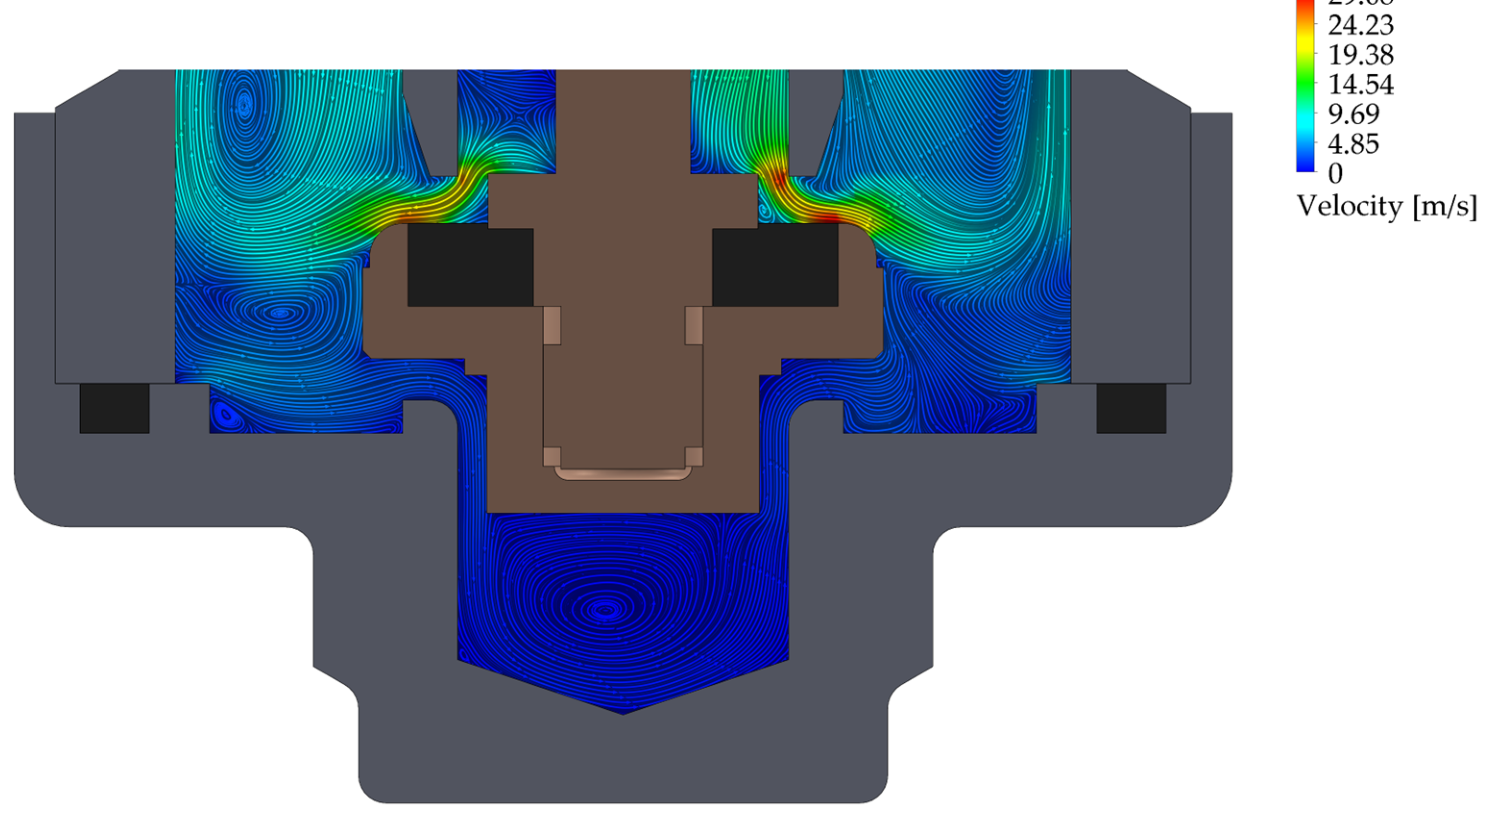
The CFD pressure field showed that the dominant pressure decrease occurred through the valve seat and throttling gap, followed by partial recovery downstream. As the flow passed the restriction it accelerated into local jets before expanding into larger cavities, where separation and recirculation developed.
The steepest pressure change was concentrated around the seat and narrow flow passage rather than distributed uniformly through the valve body.
Localized acceleration, sudden expansion and recirculation explained why hydraulic losses increased as demand moved toward the upper end of the operating range.
Velocity contours exposed jets and recirculation
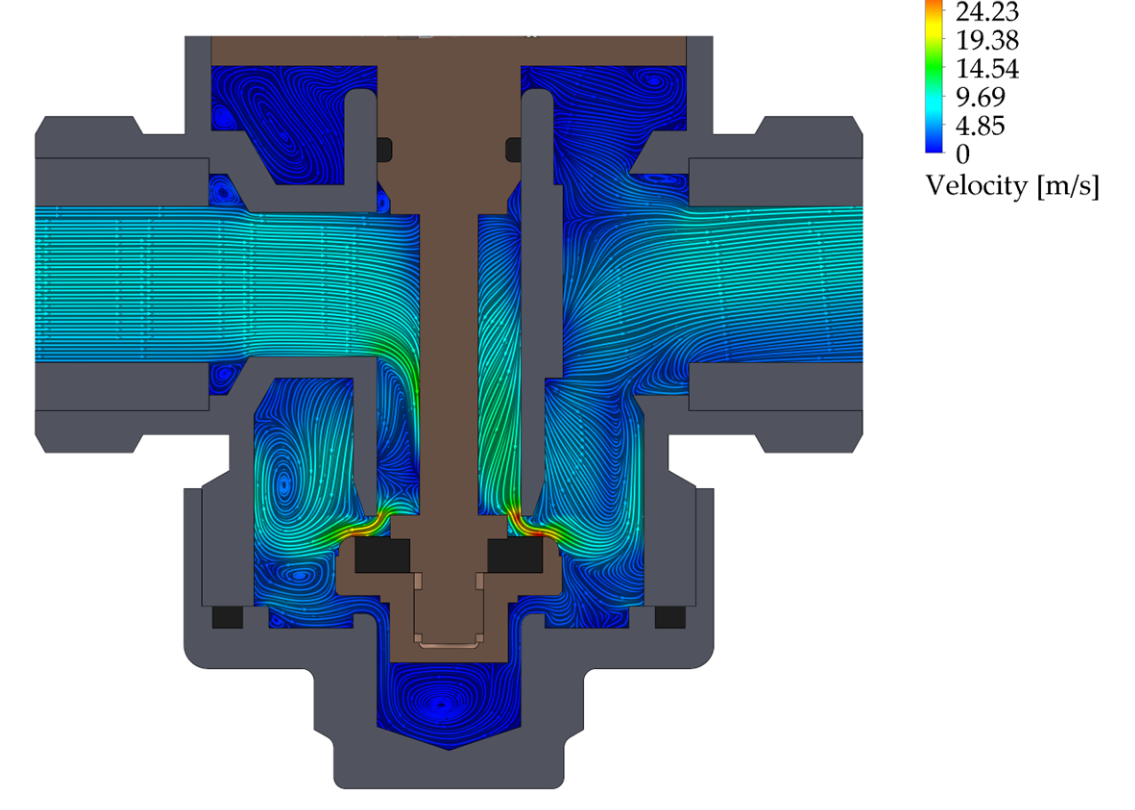
The velocity results provided a closer view of how the restriction generated the hydraulic loss. Flow accelerated sharply through the seat region before expanding into the downstream cavities, where separation and recirculation developed.
The highest velocities were concentrated around the narrow seat opening, confirming the throttling region as the controlling flow passage.
Streamlines showed separated flow and rotating structures after the restriction, providing a clear physical explanation for the increasing loss at higher demand.
Measured data confirmed the numerical trend
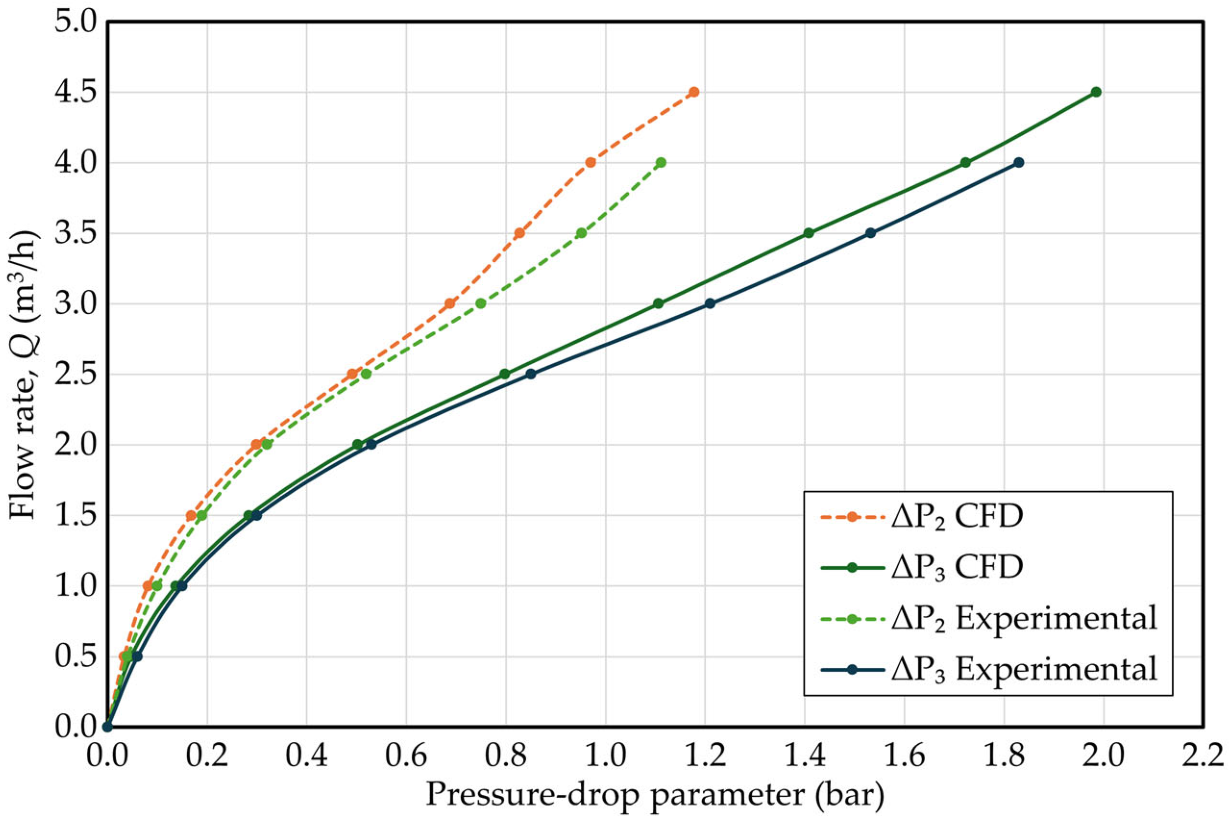
Predicted downstream pressure and pressure drop followed the physical test data closely across most of the operating range. Agreement was strongest at low and intermediate demand, while the difference increased toward the upper range as turbulence, separation and recirculation became more influential.
The maximum reported downstream pressure error remained below ten percent across the validated range.
Downstream outlet pressure provided a more representative measure of global valve performance than pressure measured locally at the control port.
By solving the internal flow at fixed openings and balancing CFD derived hydraulic force against the spring restoring force, the operating position could be predicted without a fully transient fluid structure model. The simplified workflow retained the governing regulation mechanism and was supported by physical test data.
Practical model for valve validation
The combined approach produced a defensible way to characterize regulation performance, identify where pressure loss was generated and predict how the valve opening changed with hydraulic demand. It also established a model that could support future geometry and spring design studies.
Steady state CFD and a mechanical force balance reproduced the regulating mechanism without the cost of a fully coupled transient analysis.
Pressure loss increased nonlinearly with demand, while downstream outlet pressure gave the clearest indication of the overall hydraulic response.
The validated workflow provides a practical basis for evaluating seat geometry, flow passages and spring characteristics before committing to additional prototype work.